
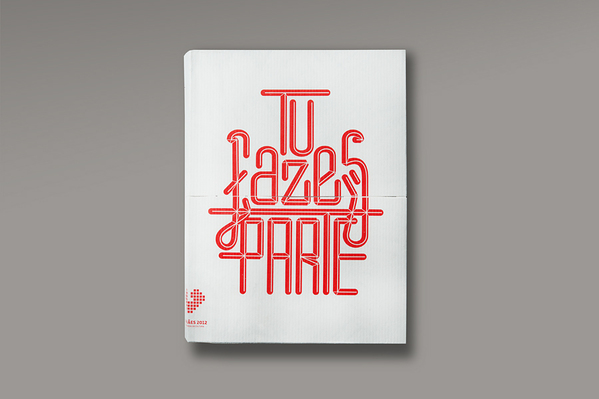
You are part of !!
Guimarães 2012
European Capital of Culture
Official Programme Book
Guimarães 2012
European Capital of Culture
Official Programme Book
We were asked by “Guimarães 2012 – European Capital of Culture” to design a piece for the opening event, displaying all
of the shows happening throughout the year, plus the usual institutional information.
Due to the urgency of this project, and the extremely short amount of time we had to make it happen, we had to find ways to quickly sort and insert the vast quantity of information into
the design document. Therefore, we've built a database containing all the programme information, allowing us to then fetch it in record time. With the help of a few good friends, we've also designed and programmed a couple of software applications, that when connected
to our database, could automatically generate and output a part of the pagination, abstract illustrations (based on real data) and navigation details.
Due to structural changes in the direction of the Guimarães 2012
(late September 2011), we've diagnosed some dramatic difficulties, that could prevent us from responding to the brief in time:
• The list of events was huge – 600 individual events
• The list of events was still open and in constant development
• The information for the events was spread across different people and several digital documents
• The original list of events was unbalanced – both time distribution and the different areas of programming were suffering either from a very concentrated or disperse calendar
• The old direction left enormous information and organization gaps, creating a general sense of distrust regarding the success of the event
• The editorial team was new and needed time to familiarize and solve these problems
From this analysis, we've concluded that:
• Information would not be available at a reasonable timing
• Information would be subject to constant review and last minute changes.
• We would have to find ways to efficiently organize and handle data, as well as provide a friendly platform for researching through it
• We would have to find ways to make the design process (even) faster and more efficient.
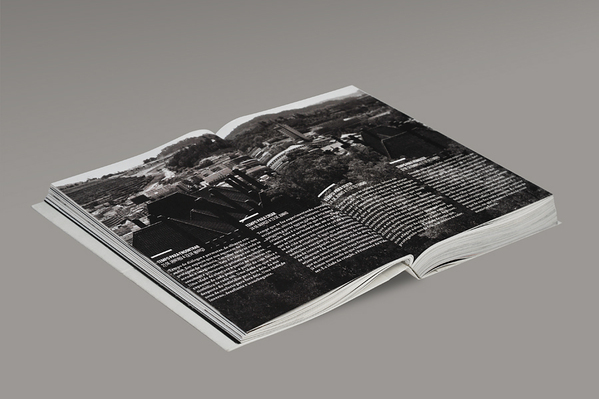
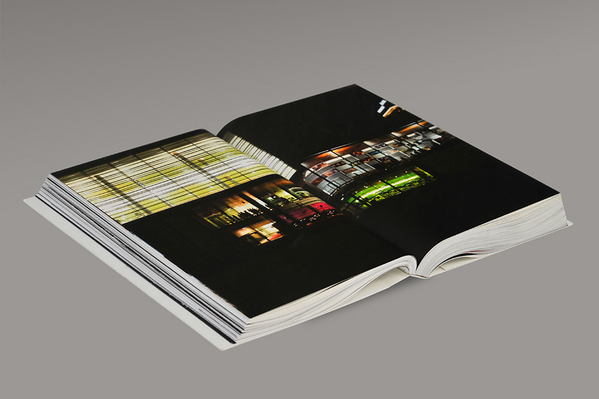
• We were facing a very low amount of available photographic material, mostly suffering from quality issues (non-professional, low resolution, , etc)
• Information would be subject to constant review and last minute changes.
• We would have to find ways to efficiently organize and handle data, as well as provide a friendly platform for researching through it
• We would have to find ways to make the design process (even) faster and more efficient.
• We were facing a very low amount of available photographic material, mostly suffering from quality issues (non-professional, low resolution, , etc)
As a processual solution, we've:
• Developed an internal database specifically for this project
• Developed methods to cross the database's information with automatized pagination softwares
• Developed methods to output illustrations based on the information in the database
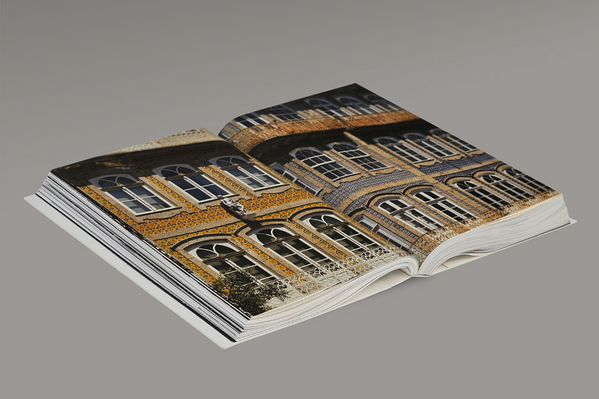
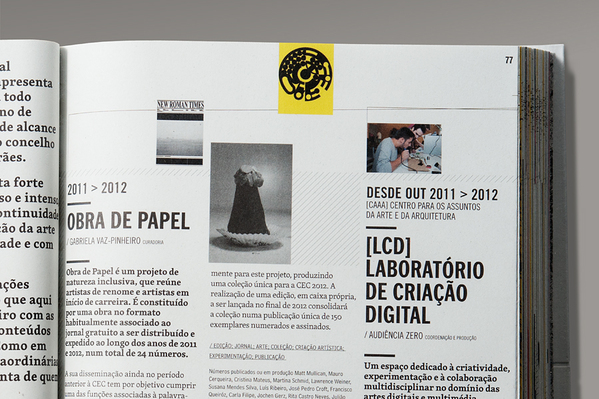
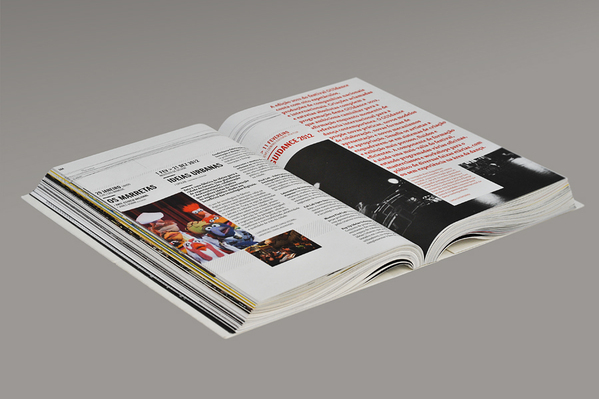
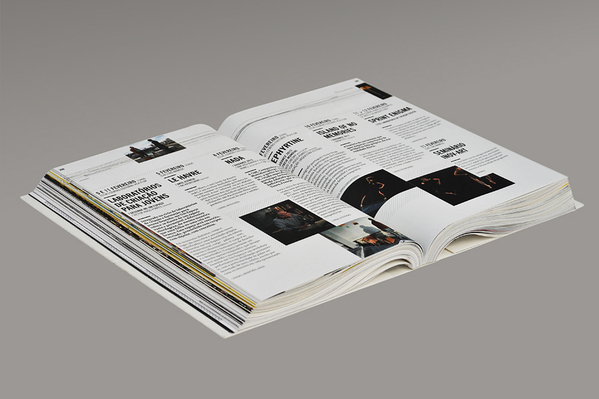
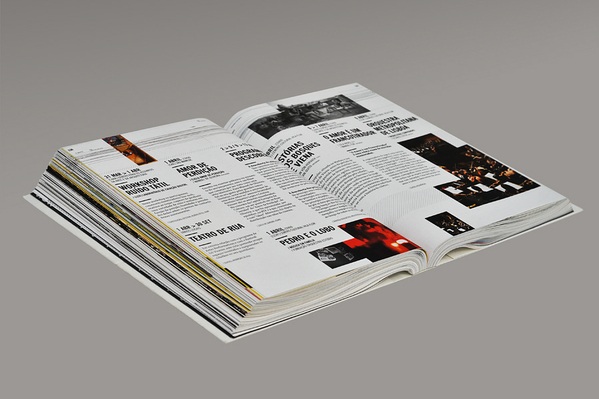
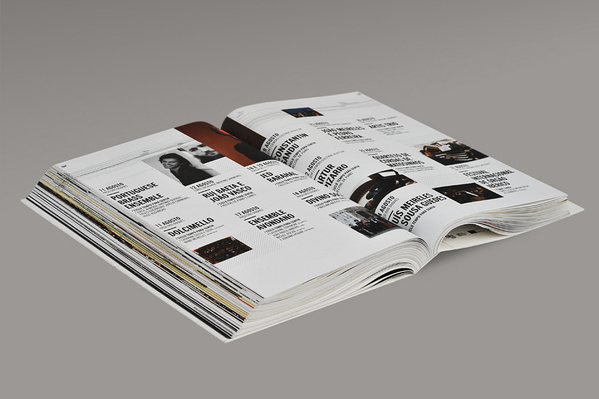
• Created a flexible grid, allowing us to use both very small and big pictures, not necessarily confined to the spread frame
• Developed methods to cross the database's information with automatized pagination softwares
• Developed methods to output illustrations based on the information in the database
• Created a flexible grid, allowing us to use both very small and big pictures, not necessarily confined to the spread frame
As a conceptual solution:
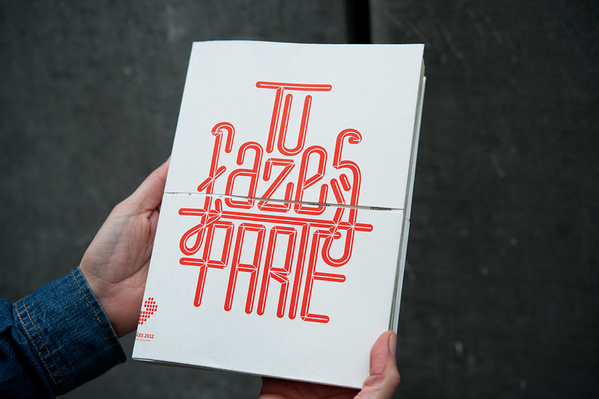
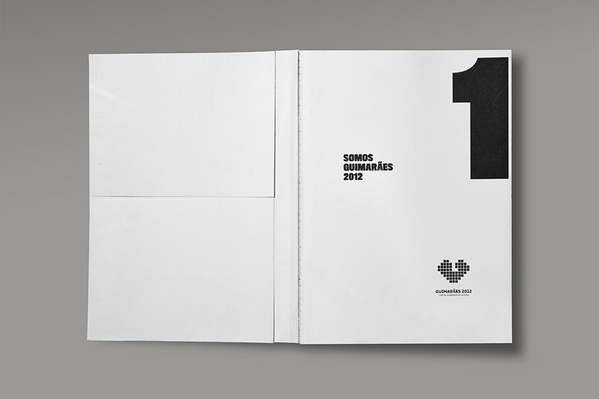
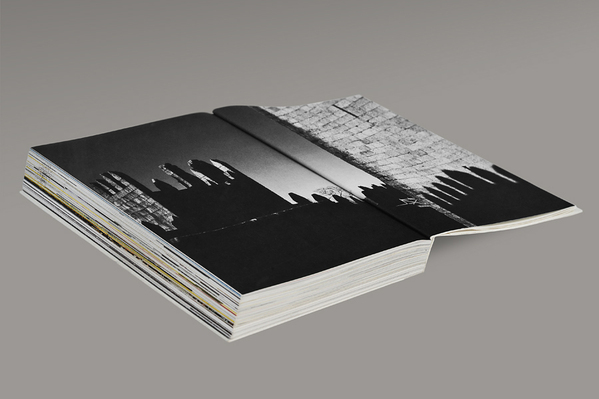
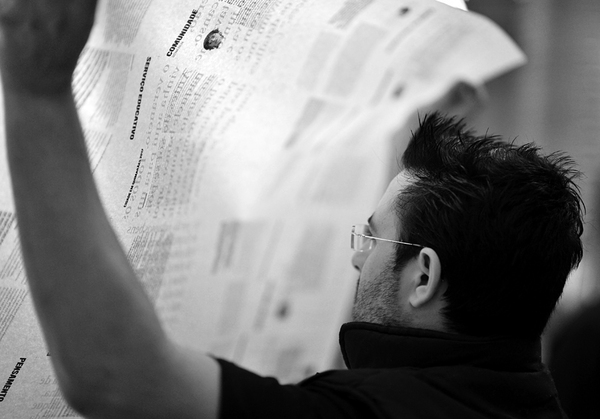
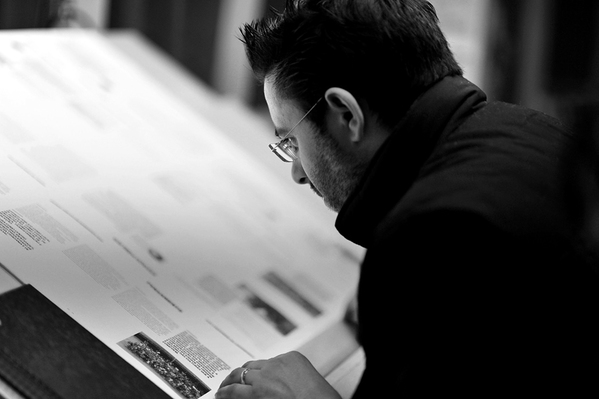
We've chosen “work in progress” as the core inspirational idea. The book should primarily look like a dossier, and, at the same time, behave like there is more information to it than the one that actually exists. Its main aim would be to provide an overview of the cultural programme, and mostly, engage the city and its inhabitants with the list of events set to happen.
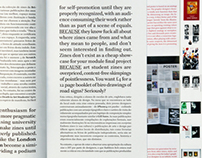
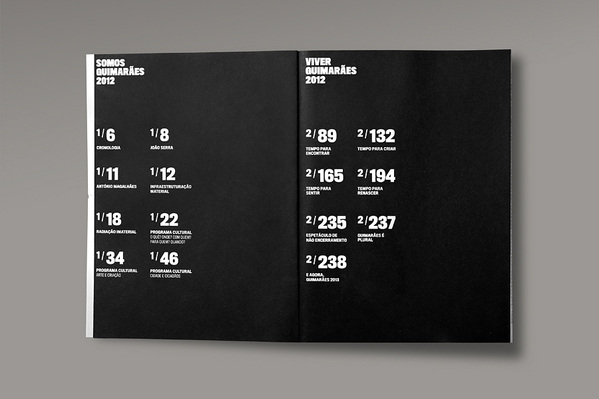
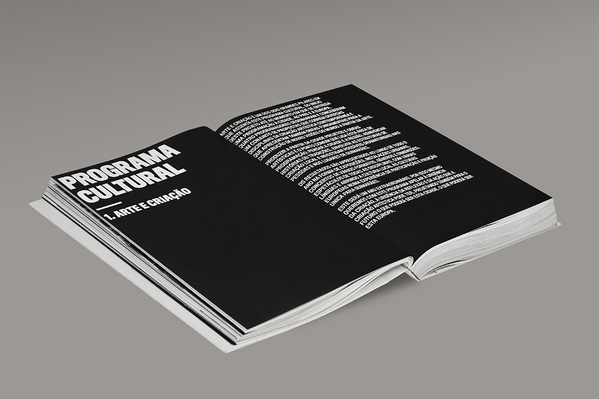
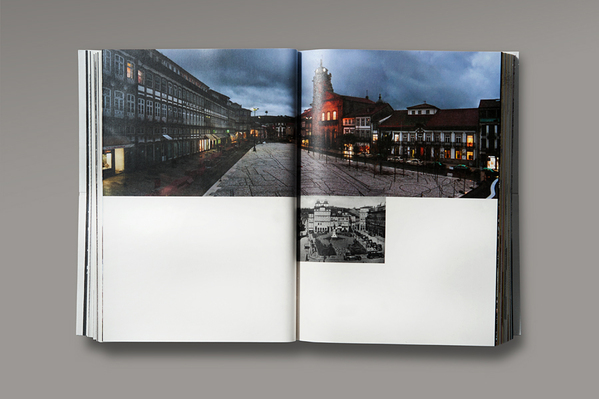
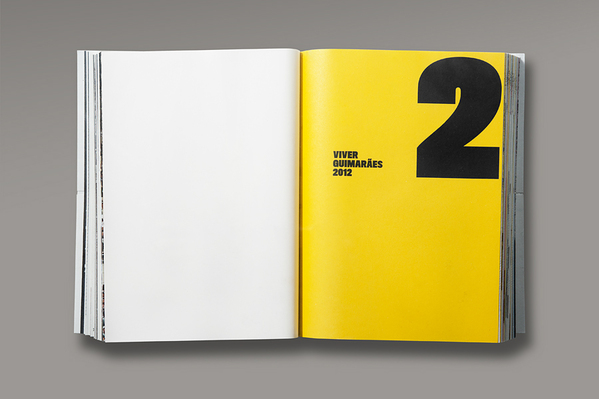
We've responded to the brief with a 250 page japanese binding style book, divided in 2 main chapters, plus an 80 page section printed in the interior of the pages.
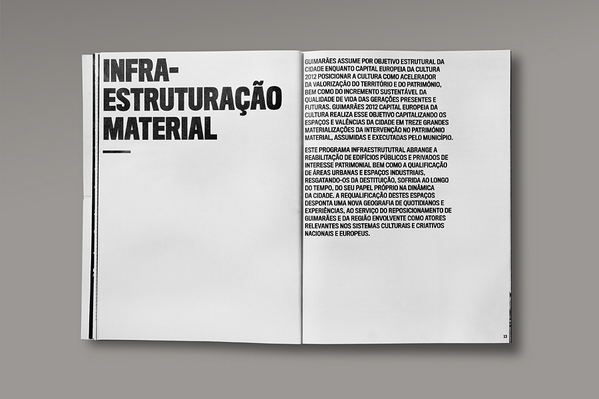
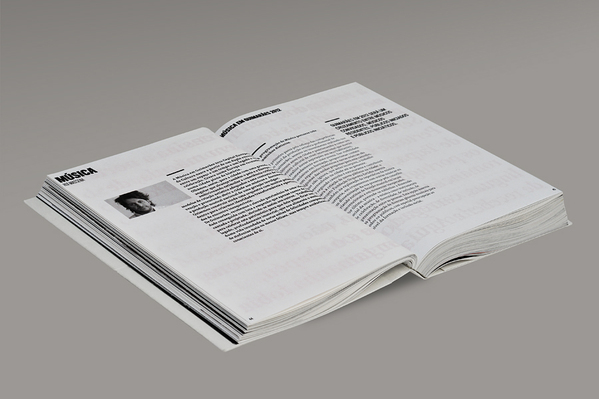
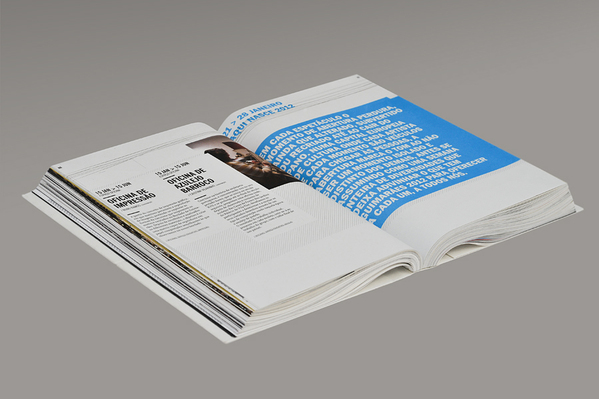
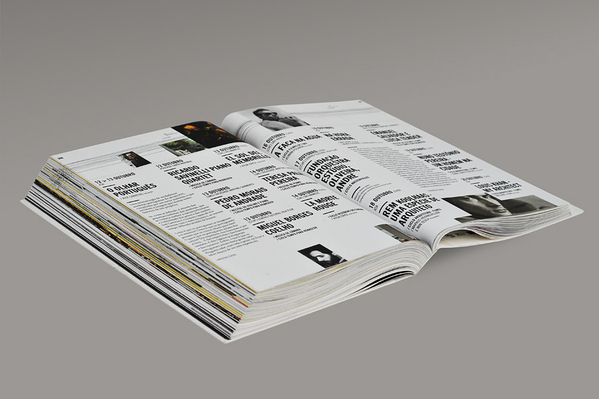
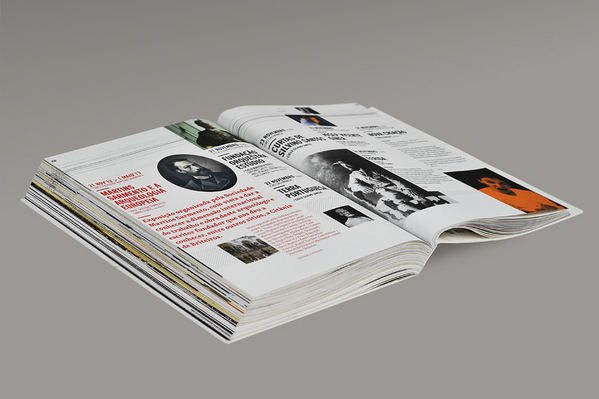
The first chapter works as an introduction to the european capital of culture – with an austere graphic look. It addresses the usual political articles and provides profiles of the event programmers and agenda according to its intervention area - either oriented to the arts, public spaces and so on…
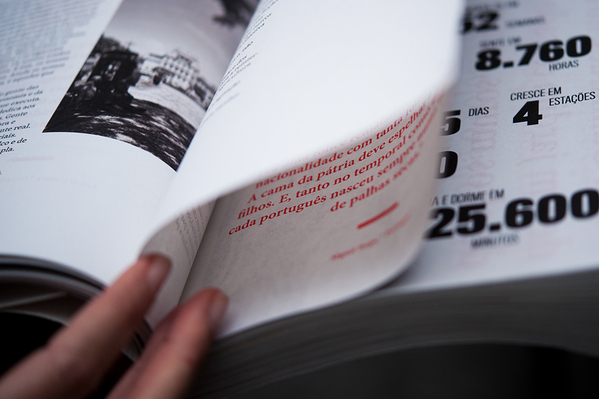
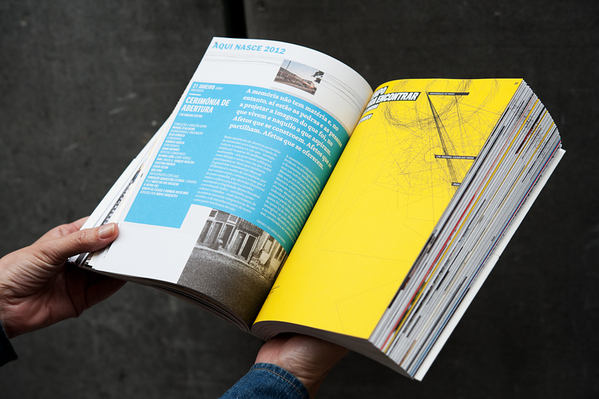
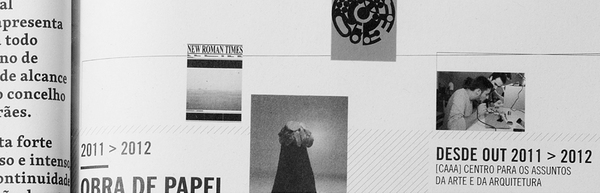
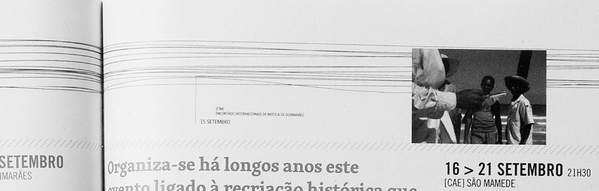
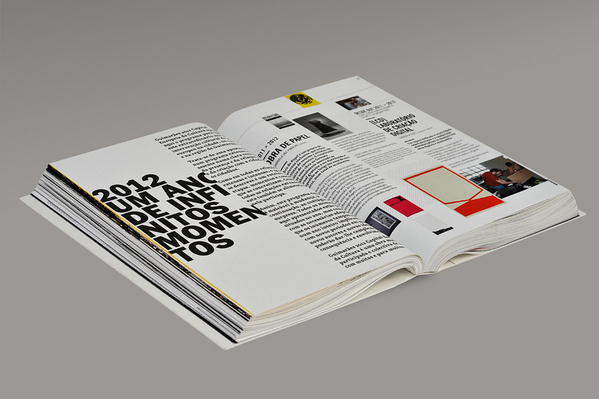
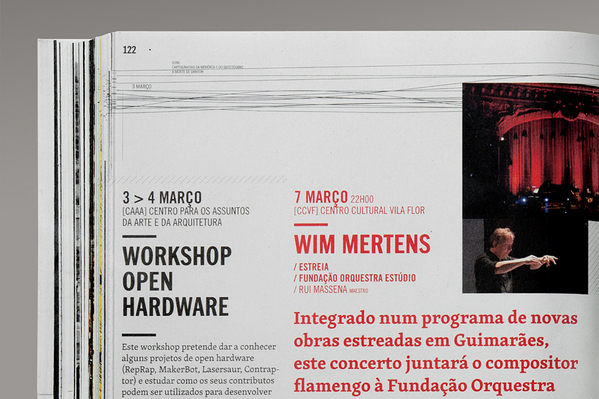
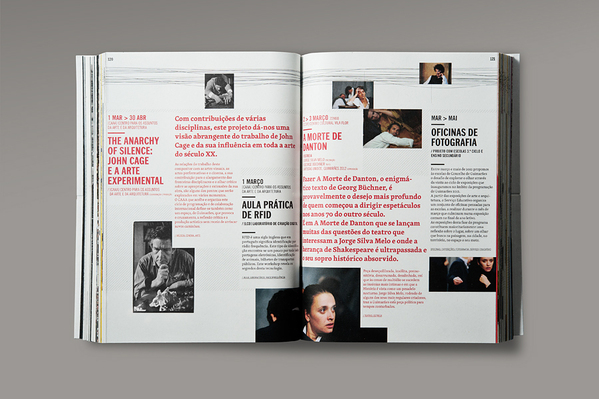
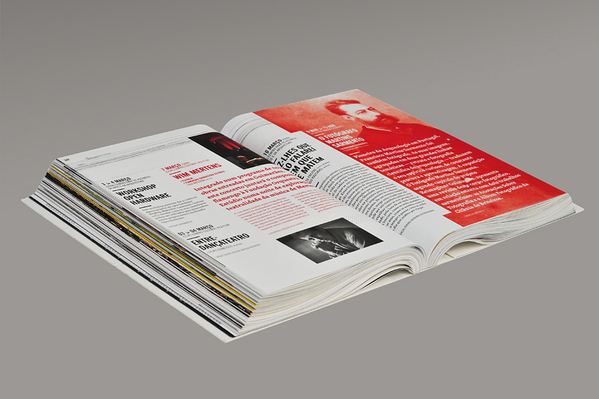
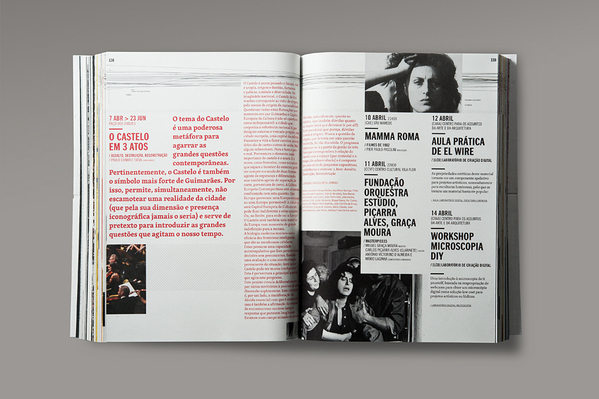
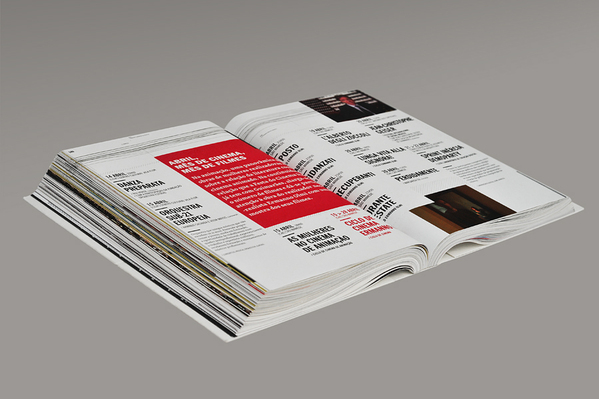
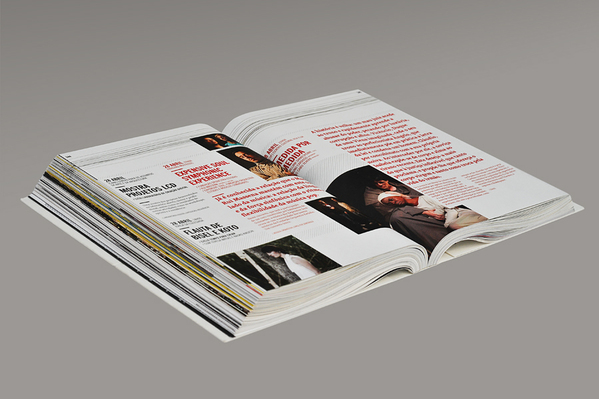
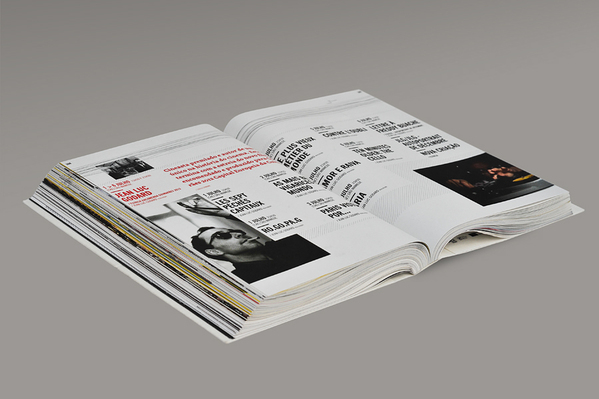
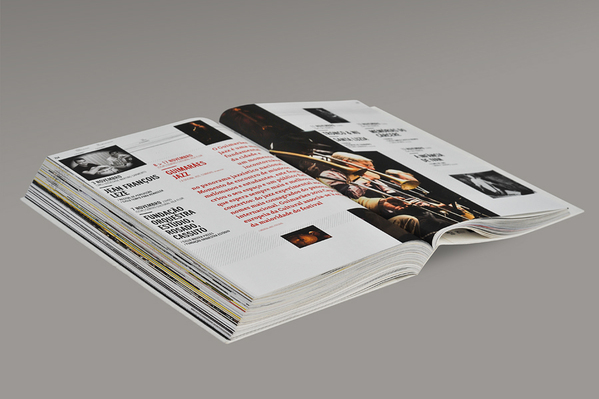
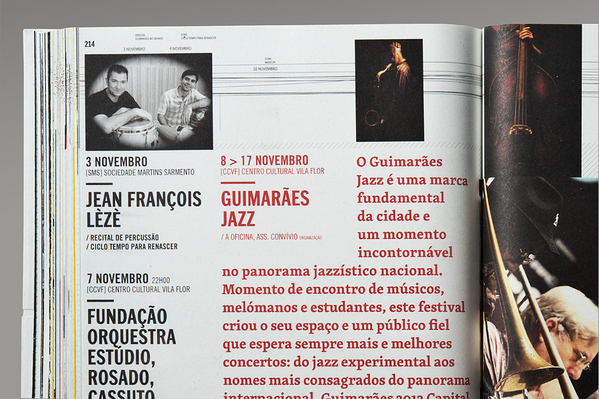
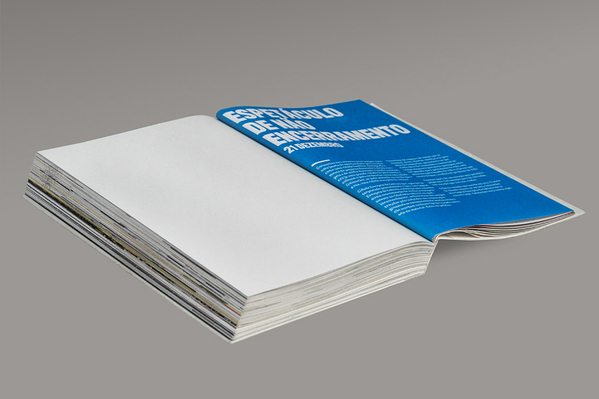
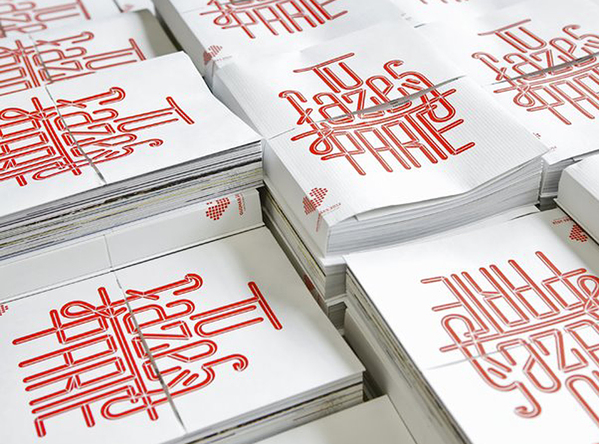
The second chapter is lively and energetic, and has a festive tone to it. It lists, both chronologically and in an agenda style, all of the predicted events and projects for the whole year.
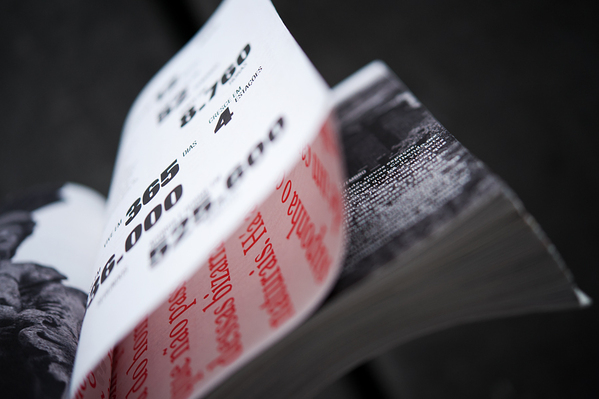
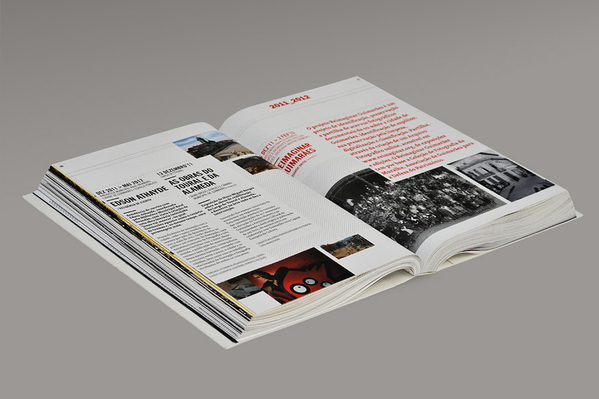
Each month has 4 or 5 highlight events, displayed in red typography, alongside the rest of the others.
We've responded to the brief with a 250 page japanese binding style book, divided in 2 main chapters, plus an 80 page section printed in the interior of the pages.
The first chapter works as an introduction to the european capital of culture – with an austere graphic look. It addresses the usual political articles and provides profiles of the event programmers and agenda according to its intervention area - either oriented to the arts, public spaces and so on…
The second chapter is lively and energetic, and has a festive tone to it. It lists, both chronologically and in an agenda style, all of the predicted events and projects for the whole year.
Each month has 4 or 5 highlight events, displayed in red typography, alongside the rest of the others.
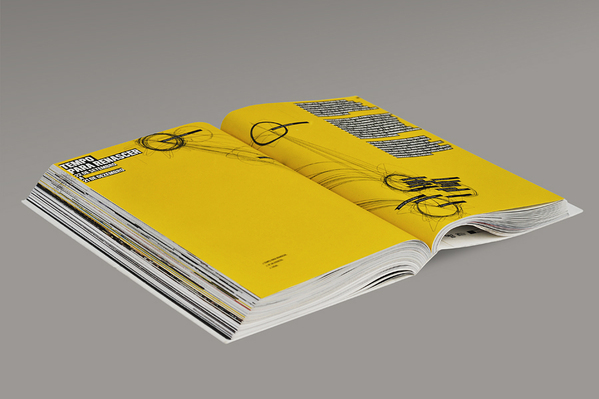
We've tried to accentuate the idea of 'work in progress' and continuity throughout the vast list of events, with a layout that could somehow also demonstrate that high number of things happening simultaneously.
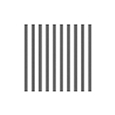
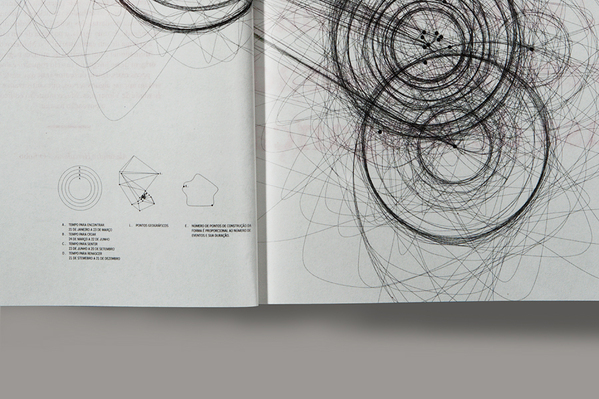
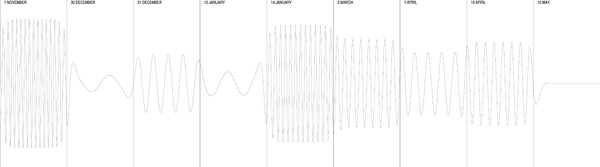
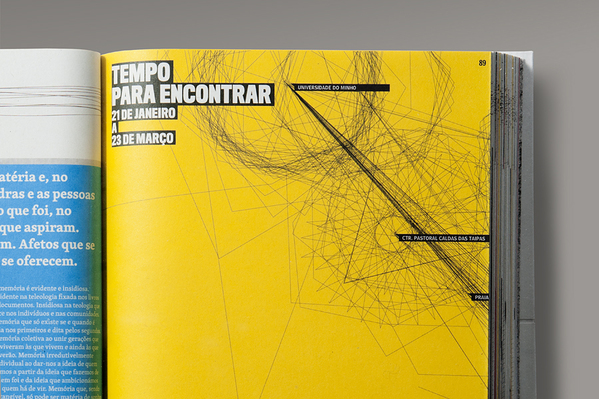
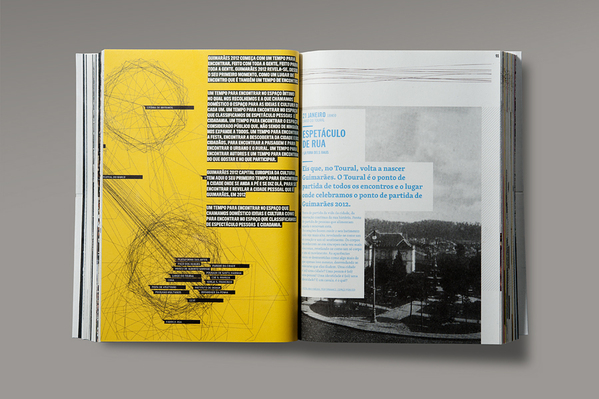
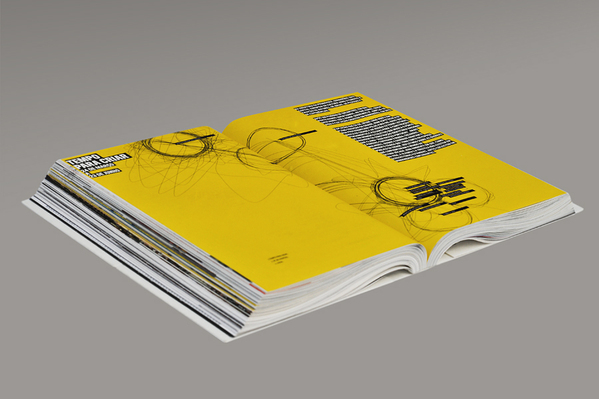
We wanted to show this in a precise and interesting manner, so we've added a timeline - a visual map - to the top of the page layout. In this navigation tool, each event that lasts for more than one day, is represented by a waving line, as if we were talking about frequencies, handling two different variables: time, or the actual duration of each event, and space, or the length each event is represented on the book's very own structure.
When all its elements are combined, a mesh of lines is created, where one can have an immediate visual perception of the amount of events happening simultaneously in a given period of time, as well as the overall duration of each individual event (by the frequency of the line's wave), and the ones that are ending and/or starting.
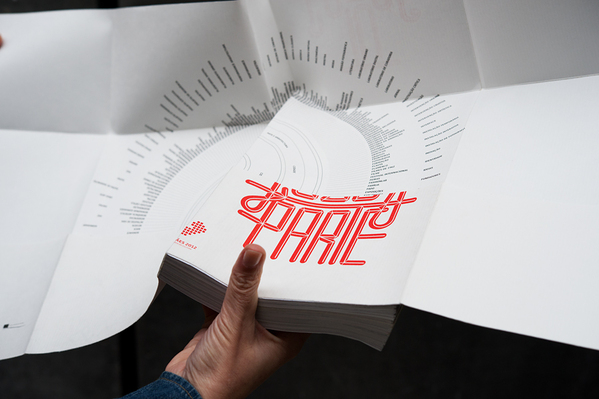
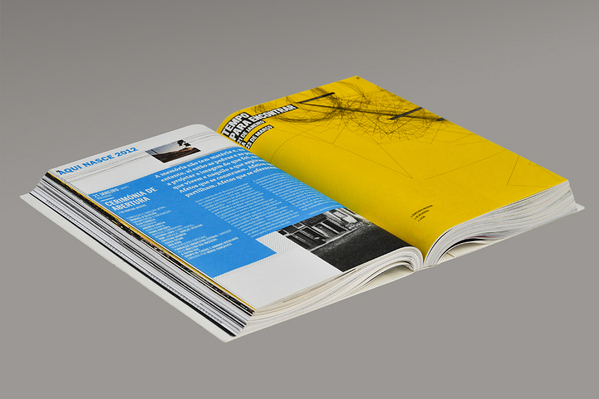
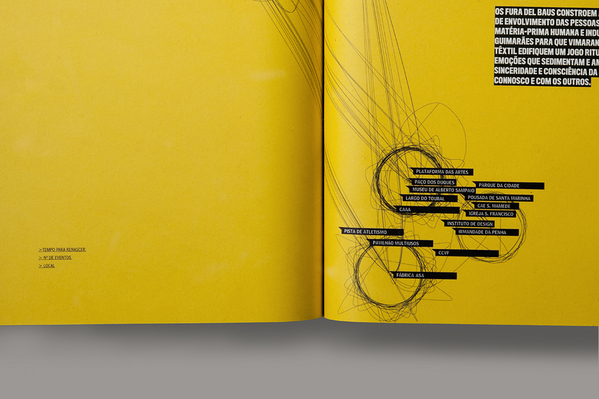
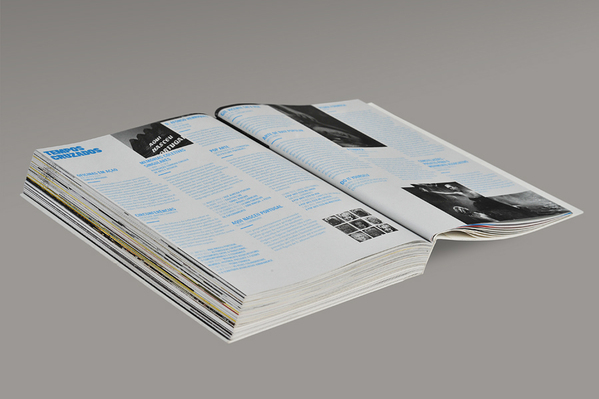
Adding to it, this bulky 2nd chapter is subdivided in 4 periods of time (seasons), each initiated by an introductory text, and an infographic illustration where one can have a visual idea, both by the number and shape of its lines, of the amount of events happening in relation to the geographic place of the various venues.
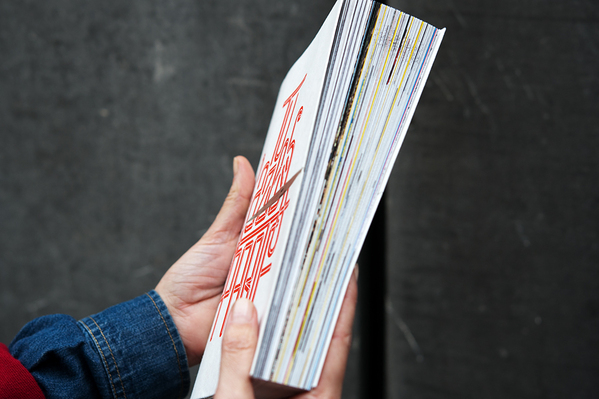
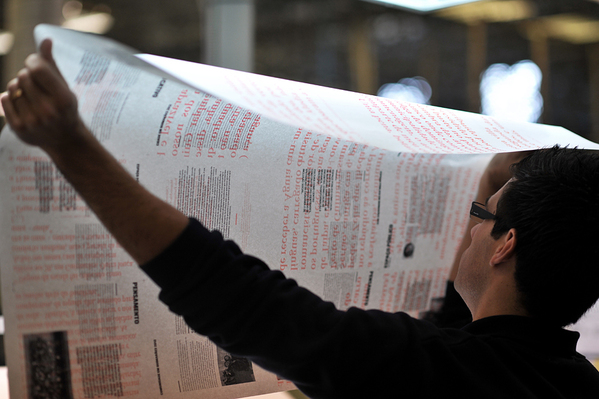
Last, we wanted to give the readers a special treat. In order to do so, we've decided to resort to a japanese book binding style, allowing us to print a few interesting texts and poems about the city of Guimarães "inside" the pages , only readable when you tear the pages open!
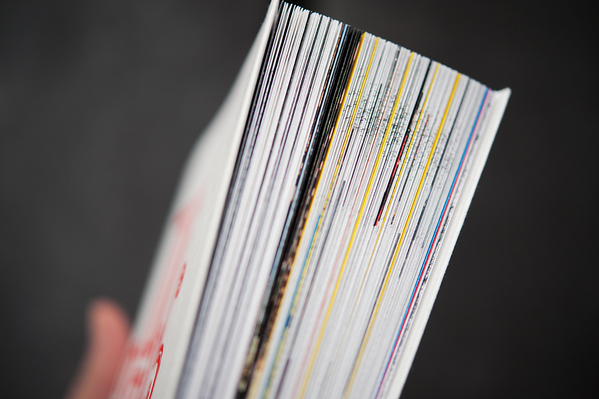
We've noticed that despite the linear way time would be represented on this part of the book, that is from January to December 2012, its structure would not be split into equal parts, as a certain month could naturally be represented throughout an higher number of pages than the previous one, depending on the amount of events scheduled for it.
We wanted to show this in a precise and interesting manner, so we've added a timeline - a visual map - to the top of the page layout. In this navigation tool, each event that lasts for more than one day, is represented by a waving line, as if we were talking about frequencies, handling two different variables: time, or the actual duration of each event, and space, or the length each event is represented on the book's very own structure.
We wanted to show this in a precise and interesting manner, so we've added a timeline - a visual map - to the top of the page layout. In this navigation tool, each event that lasts for more than one day, is represented by a waving line, as if we were talking about frequencies, handling two different variables: time, or the actual duration of each event, and space, or the length each event is represented on the book's very own structure.
When all its elements are combined, a mesh of lines is created, where one can have an immediate visual perception of the amount of events happening simultaneously in a given period of time, as well as the overall duration of each individual event (by the frequency of the line's wave), and the ones that are starting and/or ending.

Book Design
AM&J regular team
Data Illustration
Ricardo Leite design
Kaué Costa developer
Timeline
Nuno Baldaia developer
Cover illustration
Sofia Leite
Acknowledgements
José Martino
Miguel Carvalhais
Fernando Cruz
AM&J regular team
Data Illustration
Ricardo Leite design
Kaué Costa developer
Timeline
Nuno Baldaia developer
Cover illustration
Sofia Leite
Acknowledgements
José Martino
Miguel Carvalhais
Fernando Cruz
Thank You!